
- Marketing, Sales
Amazon Profitability for F&B Brands: Why Most Sellers Are Less Profitable Than They Think
By:
Sponsored by: The Amazon Whisperer specializes in helping CPG brands scale profitably on Amazon through strategy, advertising, listing optimization, creative, backend management and much more. Get started with a free Profitability Roadmap where we run an in-depth account diagnostic, identify the issues and opportunities, and deliver a 90-day plan to scale your account profitably.
Amazon can look like a winning channel long before it actually is.
Sales are coming in. Products are moving through FBA. The Seller Central dashboard shows revenue growing month over month. A founder looks at those numbers and sees something working.
What they’re usually not seeing is what happens after Amazon takes its cut of referral fees, fulfillment fees, storage charges, returns, advertising spend, coupon costs, etc, and after their own cost of goods comes off the top.
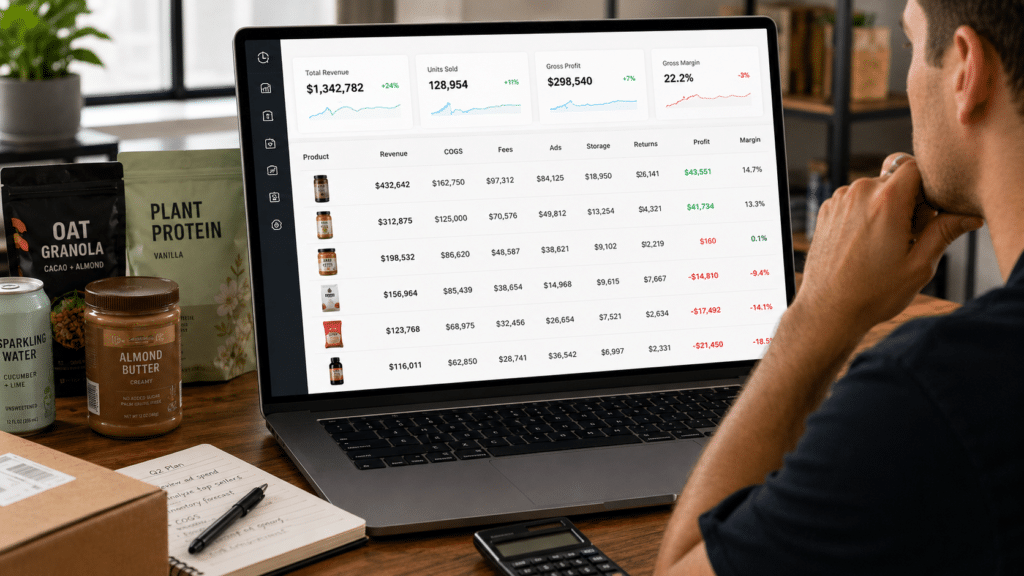
When you run that full calculation, per product, the number that’s left is often a fraction of what the top-line suggested. For a lot of F&B brands, Amazon profitability looks fine at the account level and is quietly negative at the product level.
The painful part is that they’ve often been operating at a loss for months, sometimes longer, without knowing it, because nobody ever broke the channel P&L apart product by product.
This is not a rare situation. It is often the default for brands that haven’t built the visibility to see it.
In 70% of accounts that we audit, at least one product in the catalog is actively losing money.
The Problem With Looking at the Channel as a Whole
Most brands check their overall Amazon margin and call it good. Total revenue minus total costs looks fine, so they move on. But that number hides what’s actually happening at the product level.
The pattern we see most often across F&B accounts: one or two strong products are carrying the entire channel. The hero SKU is profitable, running efficiently, generating most of the revenue. Everything else, the secondary SKUs, the newer launches, the slower-moving products, are losing money. Sometimes a LOT of money. And the hero’s performance has been covering it up so well that nobody noticed.
The real diagnostic is per-product profitability. Not total account margin. What does each individual SKU return after every Amazon fee, every ad dollar spent, every unit of storage, and your own cost of goods? That number, per product, is where you actually find out what you’re working with.
Most brands have never calculated it. They know their blended ACOS. They know their monthly revenue. But they don’t know which products are making them money and which ones are bleeding it.
Why F&B Accounts Are Especially Exposed
Food and beverage margins on Amazon often start thin before any of the real costs hit. Referral fees in Grocery & Gourmet Food run 15% if your price is over $15, and that’s before FBA fees, storage, returns, and ad spend. Stack those together and the margins get tight real fast.
F&B adds complications that most other categories don’t have. Products have expiration dates. Heat-sensitive inventory has to come out of FBA in April, which means paying removal fees and holding costs at a 3PL until fall.
A product that goes out of stock, even briefly, loses organic rank, cancels Subscribe & Save subscriptions, and takes weeks or months to recover. Fragile packaging means higher damage rates in transit, which means more returns that Amazon doesn’t automatically reimburse.
The brands that treat Amazon like any other retail channel, list the product, run some ads, fulfill through FBA, check the dashboard, usually discover all of this eventually. The ones that build profitable Amazon channels understand from the start that it has its own economics, and they manage against those specifically.
Why It Takes So Long to Notice
The Amazon dashboard is designed to show you revenue, not profit. ACOS looks manageable. Orders are coming in. Ad spend is up, but so are sales. On the surface, everything looks like growth.
Many agencies are not incentivized to grow your profit. Most PPC management agencies charge a percentage of ad spend. More spend means more revenue for them, regardless of whether that spend is profitable for the brand. They optimize for the metrics they control, ACOS, CTR, impressions, and leave the per-SKU P&L math to someone else. In most cases, no one is doing it.
The result is that brands spend years reinvesting ad dollars and inventory into products that are actively losing money. Not because the team isn’t trying. Because the visibility wasn’t there to see it.
We’ve seen this across the 50+ brands we’ve worked with. The profitability problem almost never announces itself. You find it when you go looking.
Where the Money Actually Goes
When an F&B account is unprofitable, the leak is almost always in one of eight places.
Pricing – is the most fundamental. If the price isn’t covering Amazon fees, ad spend, and COGS with at least 10% left over, nothing else fixes it. Not a better campaign structure. Not a listing rewrite. Not a Subscribe & Save push. The math doesn’t work, and no downstream optimization changes that. F&B is especially vulnerable here because of the $15 referral fee threshold in Grocery. Below it, you pay 8%. Above it, 15%. That gap alone can be the difference between profitable and breaking even on a product priced at $16 or $17.
Advertising – is where most of the active bleeding happens once pricing is right. PPC campaigns that were built for launch and never restructured, keyword targets that made sense six months ago but don’t now, auto campaigns allocating budget wherever Amazon’s algorithm decides, no negative keyword discipline. These are the structural problems that compound quietly. A brand spending $15,000 a month on advertising often has $3,000-$5,000 of that going to keywords and targets that have never converted a single sale. It just keeps burning cash.
Conversion rate – is what makes ad waste worse. Every click on a paid ad costs money whether or not the shopper buys. A listing with weak images, unclear benefit communication will hemorrhage paid traffic. We’ve seen brands with a conversion rate sitting at 2-3%, meaning 97 out of 100 people who land on the page leave without buying, spending heavily on ads the whole time, wondering why profitability is broken.
Organic SEO – is the long-term version of the same problem. Amazon ranks products for a keyword based on clicks and sales against it, paid or organic, it all counts. Brands that never align their listing copy, titles, and backend keyword fields with the search terms they’re actually converting on keep paying for every sale indefinitely. The organic rank never builds. TACOS never comes down. Every order requires ad spend to generate.
Subscribe & Save – is the lever most F&B brands are underusing. Without repeat purchases, you’re funding a new customer acquisition every order. With a well-running S&S program, a subscriber’s second, third, and fourth deliveries cost is simply the discount for them subscribing. Attach rates below 20% usually mean your discount structure isn’t competitive, or nothing in the listing is encouraging shoppers to subscribe in the first place.
The final three layers – fees optimization, FBA reimbursements, and inventory management, are lower drama but consistent profit drains. Amazon’s measurement of your product’s dimensions and weight is often wrong, and when it is, you’re overpaying on FBA fees for every unit shipped. Amazon regularly loses and damages inventory without automatically issuing credits. A brand doing $50,000 a month typically has $3,000-$5,000 sitting in unclaimed reimbursements every quarter. And inventory that ages past 180 days in FBA, or expires in the warehouse, doesn’t just stop generating revenue. It generates negative revenue through storage fees and write-offs that rarely show up clearly in the dashboard view.
What Fixing It Actually Looks Like
The brands that turn this around don’t do it by finding one big problem. They do it by working through the layers in the right order and closing each leak systematically.
Start with the per-SKU P&L. Get the real number, per product, before doing anything else. That tells you which SKUs are worth saving and which ones have a structural problem that can’t be fixed without a pricing or format change.
From there, pricing first. Then advertising structure. Then conversion. Then organic. Then Subscribe & Save. The order matters because each layer downstream depends on the ones above it being sound. Optimizing conversion on a product priced below its cost floor doesn’t help. Building organic rank on a listing that doesn’t convert is going to be very difficult.
Every layer has a fix. None of them are complicated in isolation. The challenge is knowing which ones are your problem and having a clear sequence to work through them.
One of our partner brands, Mudwtr, saw a 33% net profit increase in 60 days by working this stack in order. Not from one breakthrough move. From identifying which layers were leaking and closing them one at a time.
Where to Start
The F&B Product Profit Playbook covers all eight layers in detail. How to identify whether each one is leaking in your account, what specifically causes it in F&B accounts, and the steps to fix it. It also includes multiple free to use tools that can help you figure out your pricing, get a birds eye view of advertising performance, and score your listings performance.
If you’re unsure about whether your Amazon channel is profitable or not, this is the place to start.
Read the F&B Product Profit Playbook →
Prefer a Done-For-You Diagnosis?
The Profit Playbook is built for founders who want to run the analysis themselves, but not everyone does.
If you’d rather hand this off, our Profitability Roadmap is the done-for-you version. You pull a handful of reports from Seller Central, under ten minutes of work, and we take it from there.
We go through each one of the 8 areas of profit leaks to create an in-depth diagnostic before putting it altogether for you. What comes back isn’t just a list of problems and a “good luck”. It’s a complete roadmap: what’s broken, what it’s costing you, exactly how to fix each one, and the order to do it in.
It’s delivered as a comprehensive walkthrough on a live 60-minute call, with the PDF sent after so you can share it internally.
So if you are doing more than $50k a month on Amazon or spending more than $5k a month on ads, it’s the fastest way to find out exactly where you’re losing profit and what actions to take to fix it.
Apply for a Profitability Roadmap →
Ryan Eales is the founder of The Amazon Whisperer, a full-service Amazon management agency for CPG and F&B brands. TAW has worked with 50+ brands and generated $100M+ in revenue across their partner brands.
Education Articles