
This Week in CPG 07/20/2026
News from Jangin, Koia, Humanrace, Hint, SweetLeaf, Kidfresh, Mitra9, Sababa Foods, FAVE, Maev, Khloud, Häppy Candy and Just Shrimp.
Part of a series on Growth, Velocity and Distribution for Emerging CPG Brands
Originally published on LinkedIn Oct 1, 2020
If we are going to be discussing velocity and distribution, let’s make sure that we are all on the same page with regards to terminology and definitions. For many of you, these terms are “old hat”. However, I have worked with enough colleagues, co-founders, retailer and distributor partners to know that sometimes the velocity and distribution definitions, and therefore interpretations, are often misconstrued or misrepresented.
In this series of articles, I mostly refer to Distribution in terms of the number of retail stores where your brand’s SKUs are available. Either on the shelf or in refrigerator “doors”.
Emerging CPG brands and small companies that grow, expand their brand’s footprint via a mix of distributors, wholesalers or via direct sales to large regional and national retailers. Unfortunately, Brand Owners are not always able to access detailed data on “how well” their brands and SKUs are being sold in individual retail stores. Sometimes, the data you can freely access is too aggregated and sometimes you can purchase retailer data that gives you the granular detail you need to analyze and manage your brand. Walmart, for example, provides retail direct data for free via their Retail Link service. You cannot manage the performance of your brand if you do NOT have data on where you brand is being sold and how much is being purchased at the store level.
The most widely available data for major retailers in the Food, Drug, Dollar, Mass, Convenience, Club and Military channels is syndicated store data which can be purchased from Nielsen, IRi and SPINS (for Natural & Organic channels). Depending on the number of dimensions and geographic or retailer aggregations that you are looking for, the data can be quite expensive for emerging brands. Dimensions include, but are not limited, to Retail Sales ($s and Units), Distribution, Velocity, by Market and Time Period.
If you cannot purchase data, find a way to work with distributors or retailers to get some directional data on a regular basis. Or choose a few benchmark stores and work with the store-level department managers and staff to tease out data that can help you. Relationships make all the difference!
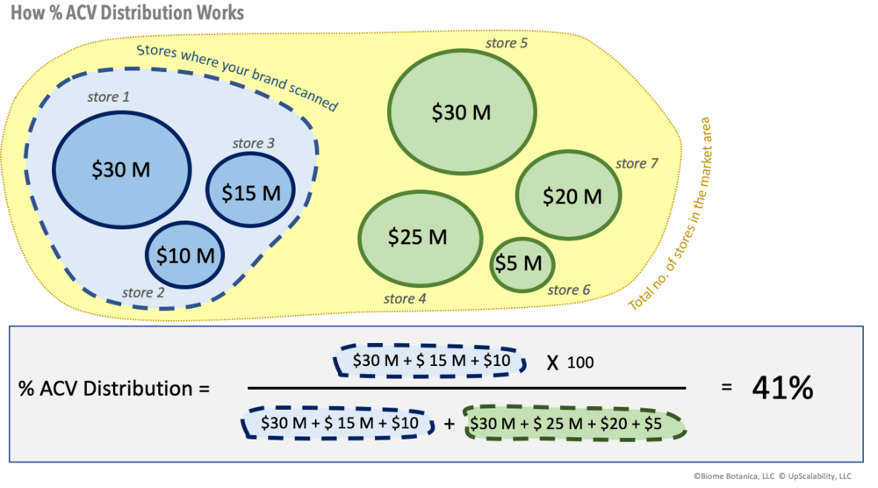
Your organization might also be measuring distribution as “% ACV Distribution”. Large multi-outlet retailers will almost certainly be measuring % ACV Distribution or even expecting you to frame your own emerging brand’s performance in these terms. % ACV Distribution, like other ACV-related data, is provided by the syndicated store data providers.
Rightfully so, many retailers, distributors, nationally-distributed incumbent brands and fast-growing emerging brands prefer to use measures that takes into account the different size of a retail store. One way of doing that is to find a way of measuring the different potential market exposure within that store and market area that each store represents. The placement of your brand in a large store that attracts more potential buyers and consumer spending in a larger market is much more valuable to a brand owner than a smaller store in a small market.
The way the “size” of a store is expressed, within the CPG industry, is via a concept called All Commodity Volume, which is more commonly known as ACV.
All Commodity Volume (ACV) is the total retail sales, in dollars, of all the different products in all the different categories that are sold in that retail store.
ACV thus represents the size, in dollars, of that shopper-base spend for that store. Every store has its own ACV value and is measured by the actual scanned sales through that store. Given that ACV is measured in Dollar terms, it is possible to aggregate that data for all the stores that make up that retail chain or all the stores within a local market area.
With ACV you can determine your brand’s share of the total market value for those sub-set of stores where your brand is available (and where it was scanned). This is known as % ACV Distribution.
% ACV Distribution is:
PS: An excellent resource for understanding syndicated data is Sally Martin’s and Robin Simon’s CPG Data Tip Sheet website. https://www.cpgdatainsights.com/
Unless you want to remain hyper-local and be a “small business”, which is perfectly fine, growth will necessitate channel, market and geographic expansion.
Yet, as savvy emerging-brand founders will attest to, expanding distribution is not that easy. Achieving placement in a multi-outlet chain can take up to a year, depending on where you are in a reset cycle. And brands need to be supported with significant trade marketing dollars. In my experience, many CPG startup companies and midsize companies that are growing or that are in “turnaround” often underestimate the amount of trade investment needed and the amount of time it takes to secure meaningful distribution.
Mark Samuel, the founder and CEO of IWON Organics launched the protein-centric snack brand in 2016. In an interview with Ray Latif on Taste Radio [1], Samuel discussed his growing pains in expanding the brand’s retail and distribution footprint to 5,000 locations nationwide.
“This is a very, very difficult business.” “It’s an expensive business. You need cash…. You can build it very slowly, you can go brick by brick and go into your local store or your regional store or even go Direct-to-Consumer on a small level — and try to build that way or you can sort of push the envelope and go regionally and try to then push and try expand from there, but in order to do that, in order to do the latter, you need money and its expensive. There are things that often many don’t know, or I didn’t know specifically when I started this … there was things like promotions, TPRs (Temporary Price Reductions), and demoing…things that are going to help get the product off the shelf that you are almost required to do…again unless you are willing to go brick by brick.”
The go-to-market and value chain can be complicated. The web of Brokers, Distributors, Re-distributors, Sales Commissions, and Direct to Retail sales vs, Distributor vs Direct Store Delivery territory conflicts, can get messy. Initial brand-owner gross margins can be in the very low double digits. Certainly not the “standard” 40% that is usually modeled into pitch deck forecasts. On a side note, it is interesting how many seed and early stage investors, within CPG, completely miss this dynamic when looking at Year 1 and Year 2 projections. I suspect that many emerging brands do not achieve their initial volume and margin projections.
Within the U.S. there are just over 38,000 grocery/supermarket stores, that generate sales in excess of $2 million annually per store, according to 2019 stats from Progressive Grocer [2]. This includes conventional supermarkets, natural & specialty food stores & supercenters. Progressive Grocer also reported that just over 62% of grocery retail sales flow through conventional supermarkets. About 95% of grocery retail sales are accounted for by supermarket chains that have 11 or more stores.
There are also over 150,000 convenience stores and over 700,000 [3] on-premise restaurants and bars in the US. Overall, there could well be close to 1,000,000 on and off-premise retail outlets for CPG products in the US. These outlets include bodegas, gas station kiosks, supermarkets, club stores, drug stores, restaurants, bars, liquor stores, liquor stores, beauty stores, and other discount and retail stores such as home improvement stores (that sell limited assortment items). That is a lot of distribution territory to cover.
Distribution, from a sales expansion perspective, indicates the extent to which a brand has expanded its availability, within targeted channels, in a particular market area or geography.
Distribution expansion (or contraction) is measured as the total “level” of Units-of-Distribution within the period being reviewed. A Unit-of-Distribution can be:
Expanding distribution too rapidly and in an undisciplined manner is not the answer and not sustainable. Dr. James Richardson’s fact-based research [4] uncovered some hard realities. Richardson’s words sums it up best:
“In fact, there are virtually no instances of distribution prowess alone driving explosive growth anywhere in consumer-packaged goods. Not even the most successful new brands launched by public firms in the past 25 years used distribution and only distribution to scale, even though they have the best access to it in the world.”
Depending on your brand proposition and your core target consumers, a strategic and measured roll-out approach that targets specific market areas and specific retailers will get you an appropriate ACV penetration. This can be achieved without also suffering corresponding decline in velocities. Expanding distribution too quickly, especially when velocities are weak, can lead to eventual delisting and can also lead to a failure-inducing cash flow crunch. Richardson’s research showed that it is quite common for velocity to “collapse” as distribution breadth “ratchets up prematurely”.
So let’s start diving a bit deeper into velocity.
In physics, velocity is defined as the rate of positional change that a moving object achieves over a given period in a given direction. Velocity is measured as distance over time, like miles per hour or meters per second in a particular direction. (As a matter of interest for the geek in you, speed is velocity without the specification of direction.)
Within the CPG category, retailers, distributors and brand-owners usually refer to velocity as follows:
Velocity is the rate of retail sales that a brand or SKU achieves through a store, group of stores or market area over a defined period of time.
Sales can be depicted in Dollars or in volume which is mostly quantified as selling units.
Velocity is at the core of sales growth and is more than just an indicator of sales. The power of the velocity measure comes to life when you use it to compare two periods for the purpose of course-correcting or accelerating the strength of your brand.
A change and more importantly, the size and direction of that change can expose how well your brand or SKU is performing and growing (or not) from the following two distribution-related perspectives:
Retailers and Brand Owners can use different types of “Rate-of-Sales”, depending on the specific measure and improvement area that they want to target or compare. These different types include:
Example #1: A total of 1,560 mayonnaise jars are sold over two months in 15 stores. The velocity for that SKU is 12 units per store per week (12 = 1,560 ÷ 2 × 12 ÷ 52 ÷ 15).
Example #2: $240,000 worth of granola bars are sold over 4 months in a retail chain where your % ACV Distribution for all the stores in that market is 25%. The velocity or Sales Per Point of Distribution (SPPD) per month is $2,400. ($2,400 = $240,000 ÷ 25 ÷ 4).
More important than the absolute value of velocity itself, is whether velocity is increasing or decreasing. A velocity that is increasing is one of the strongest signals of brand strength and equity. Velocity changes when either or both Sales and the Unit of Distribution change. Given that the numerator and denominator can change at different positive or negative percentage levels between two periods, you can actually achieve the same level of velocity and change via a number of different combinations of positive or negative changes in sales or the units-of-distribution. That is why it is really important to understand how and why the velocity is changing.
Retailers will use your velocity and growth to place you in the stores or even delist you if the brand is not performing. The top distributors will too. Of course it is not always as simple as that, as category dynamics and incrementality (which I will cover in a subsequent article) are also taken into account. Is your brand or can your brand achieve sustainable and growing velocities that lead the category? Or is the velocity in the bottom quartile? Do you even know?
Many companies also compile their own measures or a mixture of proprietary and purchased data in order bridge data gaps in channels and retailers served. Irrespective of how you do it, what is more important is that you regularly measure velocity so that velocity becomes a singularly core metric to hold your entire team’s feet to the fire! I am talking about Sales, Marketing, Operations, HR and Finance. It can be quite a unifying culture-builder and call to action!
About Manoli
Manoli Kulutbanis is the founder of Biome Botanica, LLC and the Managing Partner of UpScalability, LLC. Manoli recently launched Margin Velocity Planner ™, a tool that helps founders to build credible velocity-based growth and financial plans for emerging CPG brands. More details are available on marginvelocity.com
References
News from Jangin, Koia, Humanrace, Hint, SweetLeaf, Kidfresh, Mitra9, Sababa Foods, FAVE, Maev, Khloud, Häppy Candy and Just Shrimp.

Creating a great product is only the beginning. The real challenge is getting people to notice it, remember it, and ultimately buy it. In this conversation, I sit down with
Discover ten top packaging design agencies that specialize in creating visually compelling and strategic packaging solutions to help CPG brands stand out on shelves and connect with consumers.