In the fast-paced world of Consumer-Packaged Goods (CPG), knowing how well your products are doing in their category isn’t just a choice – it’s a necessity. It’s not just about having an excellent product and strong marketing; it’s about truly comprehending how your products measure up in their designated space.
With businesses striving for better decisions in this competitive arena, the ability to precisely gauge and analyze product performance has taken center stage. Today, we’re embarking on a journey to unravel the art and science behind assessing CPG product performance within a specific category.
When comparing your CPG product’s performance within its category, understanding which metrics can provide the most valuable insights is key. While there are many key metrics that help you gauge how your product is performing relative to the category and its competitors, there are a few that stand out, like:
- TDP (Total Distribution Points) and TDP % Change
- Velocity and Velocity Change
- Sales and Sales Growth
These metrics, when harnessed effectively, paint a vivid picture of your product’s performance trajectory and its positioning within the competitive category landscape. Although a scoreline rarely tells the whole story of a game, the same is true for retail performance. Broad metrics like sales volume or total distribution are topline snapshots; growth-minded CPG manufacturers are more often interested in the nuanced, dynamic trends driving those leading indicators. This is where Byzzer can come into play.
Empowering Emerging Brands Through Byzzer
Byzzer is NIQ’s platform for Emerging Brands, which accelerates the speed to insights and simplifies data analysis, so clients don’t need an army of analysts. Byzzer supports subscription and ad hoc purchases with access to data in less than 5 minutes.
The Item Ranking report, offered in Byzzer, is the “league standings” of individual product performance. It tells you which items are the most productive in your category and shows how your product stacks up. By ranking products by individual item, you can make like-to-like comparisons for all products in your portfolio. You can also identify assortment opportunities and risks.
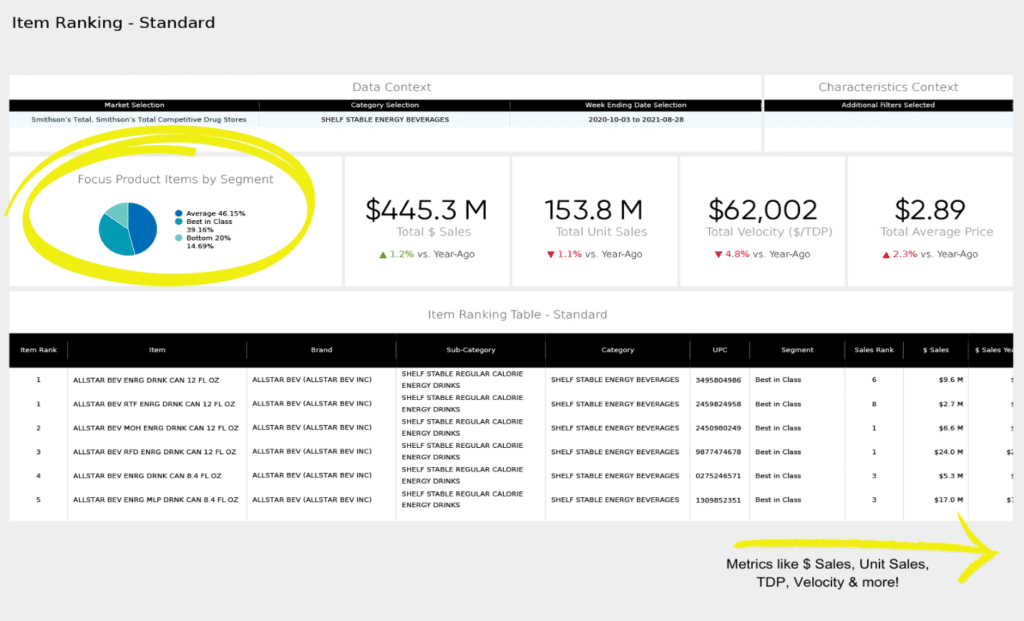
How to Read the Item Ranking Report
The Item Ranking report is exactly as it sounds: a numerated list of top-performing individual products in a category for a selected market and period. You can also limit this report by product characteristics, allowing you, for example, to rank all “organic” products in the category so you can benchmark against your true competitive set. The rank accounts for total sales, sales growth, Distribution, Distribution growth, and velocity (sales per point of distribution) to factor in who is performing the best, not just who is the biggest. The Best-in-Class brands are those which are ranked in the top 20% (note, the rank is always looking at the item across the entire category which is exactly how a buyer will assess their category).
The first product listed is the best-performing product in the category. Each subsequent item is listed in descending order of total sales. The first three columns – Item, Brand and UPC – are descriptive, but the further you scroll, you’ll find metrics like: $ Sales, $ Sales LY (Last Year), Unit Sales, Unit Sales LY, Average Price, Average Price LY, TDP, TDP LY, Velocity, and more! The report also contains an additional chart that displays the top brands in the category, selected automatically. These are broken down by the number of each brand’s items that appear in the top, middle or bottom third of the ranking.